Once you have a couple of Bitcoins in your wallet, the next thing that is likely to be your mind is trading the coins for a profit. Monitoring the price of Bitcoin will help you determine the most appropriate time to buy, sell, or hold onto your coins. Understanding Bitcoin price charts will help you make tidy profits from Bitcoin trading.
Reading these charts can be daunting, particularly if you are a newbie trader. To make matters easier for you, experts opine that you must first learn how to determine the price of Bitcoins. Similarly, you must learn about the types of price charts that are available. This will help you know how to read the charts. In doing so, you will be able to predict Bitcoin price trends.
Types of Charts
There are types of Bitcoin price charts. Each of these reflects a different level of details that users want.

Simple Bitcoin Price Charts
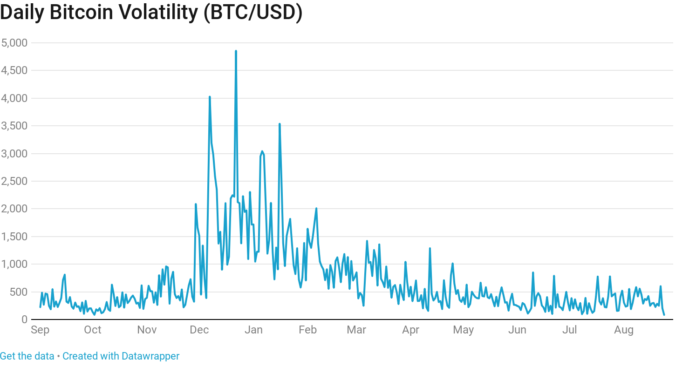
These charts display the price of Bitcoins on the Y-axis, and time on the X-axis. The prices can be in Dollar, Euro, or any other denomination. On the other hand, the time displayed on the horizontal axis can be in days, weeks, hours, or months depending on the granular that users want to get.
Often, simple line charts default to linear scales, which give equal weight to all price changes that occur across the entire scale. This is a convenient way of gauging prices boldly. CoinmarketCap is arguably the most popular provider of simple Bitcoin price charts.
Bitcoin Candlestick Price Charts
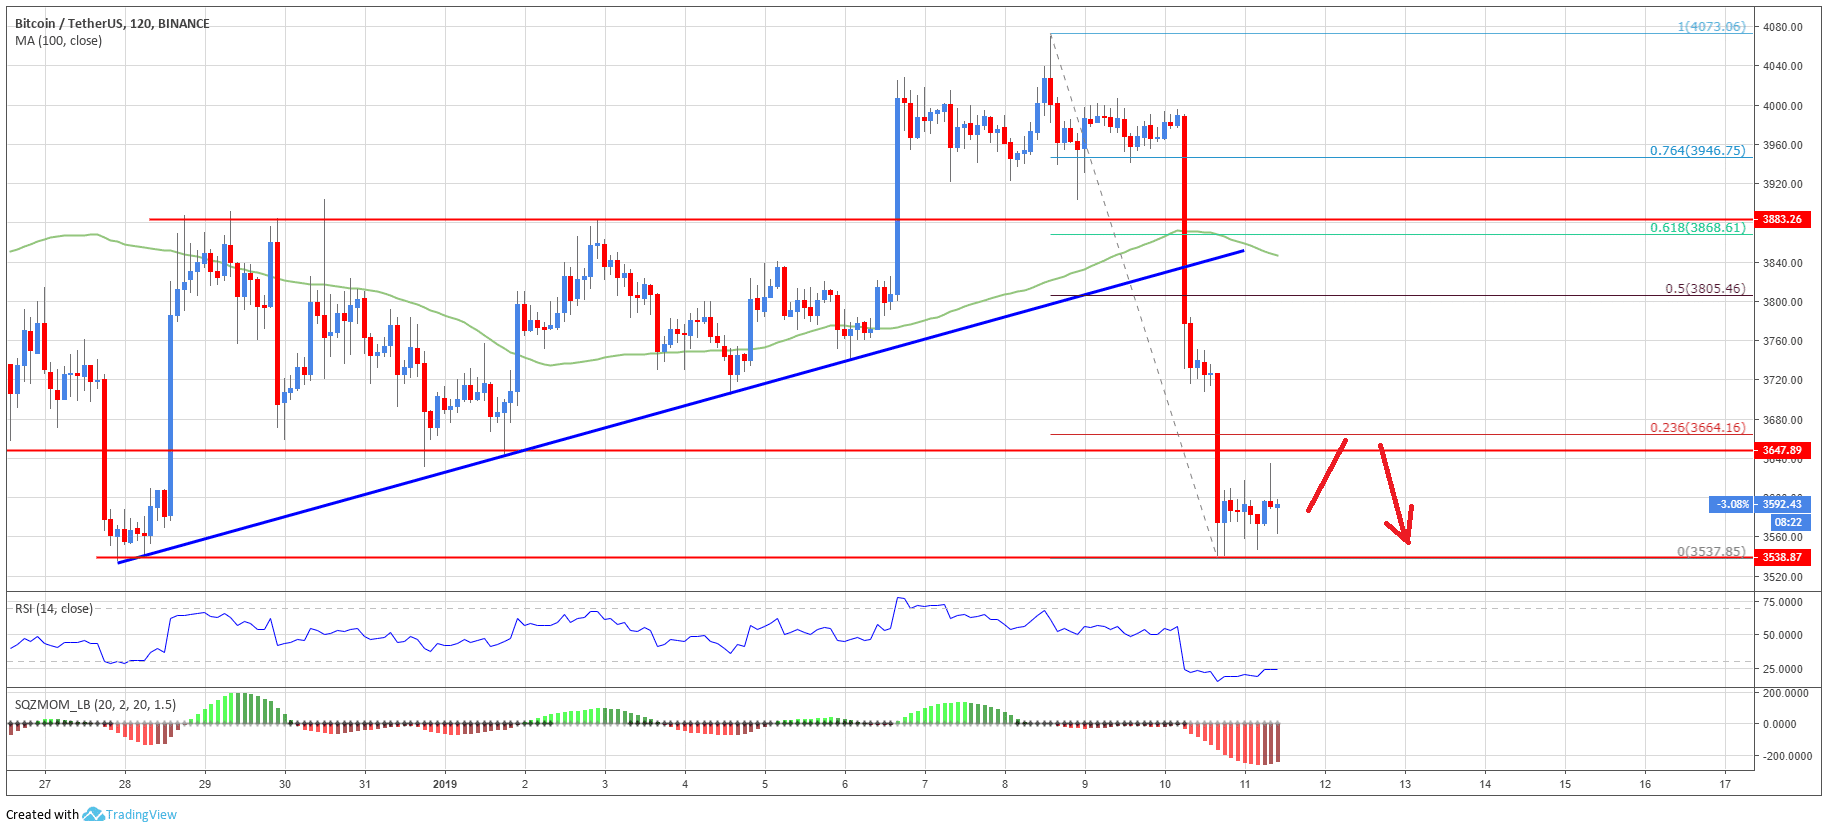
Bitcoin candlestick price charts derive their name from the fact that unlike in simple charts, individual data point plots are replaced by candlestick-shaped vertical rectangles. These rectangles have a wick at the bottom and top.
Tradingview is the most popular provider of candlestick Bitcoin charts. You can also get the charts from major cryptocurrency exchanges such as Bitstamp and Bitfinet. Price charts from these platforms come with a high level of customisation and detail. For instance, users can find out the historical price movement of Bitcoins on these exchanges.
How to Predict Price Trends
You can only make healthy profits from trading if you can forecast Bitcoin price movements. To undertake price prediction, you can either conduct technical analysis or fundamental analysis. The latter entails analysing the underlying forces of a company or an economy.
Technical analysis entails attempting to forecast the direction that Bitcoin prices will take. This forecast is based on previous market data, volumes found on past price charts, and historical rates.

To undertake technical analysis of Bitcoin prices or volume history, you will undoubtedly need charts that display prices in a readable manner than plain number tables. Coindesk’s price index is the best place to find Bitcoin price charts.
Conclusion
Thousands of Bitcoin enthusiasts are reaping millions of dollars from trading their coins. If you have Bitcoins in your wallet, you shouldn’t hesitate to join the bandwagon. Nonetheless, your venture is likely to fail if you do not understand Bitcoin price charts as well as trading strategies.


